
 Thanks to a solid effort by
  To provide some perspective, let's look at certified GA aircraft first. From its peak in 1978, U.S.-manufactured GA deliveries have fallen dramatically, by 93% from 14,398 single engine piston aircraft in 1978 to 986 in 2014. Fortunately, since 2000 the continuing drop is less severe, for example in 2006, worldwide GAMA members reported delivering a new millennia peak of 2,513 aircraft; the decline to 986 is a drop of 61%. The '60s and '70s were clearly the "golden era" for GA piston airplane production. Accounting for this drop, beside pilot population decreases (see below) and airplanes lasting so long — the average age of four seater is 38.2 years old — most competition likely came from non-flying activities. Among aircraft choices, Experimentals in the last two decades have grown 143% to nearly 25,000 aircraft. LSA in fully built or kit form add to GA's competition although much less so partly as Experimentals have been around much longer.
Overall, the overall GA fleet has held reasonably steady despite the references above, declining from a peak of piston airplanes in FAA's registry of 197,442 in 1984 to 137,655 in 2013, a drop of about 30%. When you add kit-built aircraft and LSA, the total fleet numbers look relatively stable.
In geographic location of that U.S. aircraft fleet the conventional knowledge about the biggest three states still holds, with California having 26,141 aircraft registered, followed by Texas at 22,851, trailed by Florida at 18,162. The next closest state (Washington) has barely half the Florida count ... but see below for where pilots live.
To provide some perspective, let's look at certified GA aircraft first. From its peak in 1978, U.S.-manufactured GA deliveries have fallen dramatically, by 93% from 14,398 single engine piston aircraft in 1978 to 986 in 2014. Fortunately, since 2000 the continuing drop is less severe, for example in 2006, worldwide GAMA members reported delivering a new millennia peak of 2,513 aircraft; the decline to 986 is a drop of 61%. The '60s and '70s were clearly the "golden era" for GA piston airplane production. Accounting for this drop, beside pilot population decreases (see below) and airplanes lasting so long — the average age of four seater is 38.2 years old — most competition likely came from non-flying activities. Among aircraft choices, Experimentals in the last two decades have grown 143% to nearly 25,000 aircraft. LSA in fully built or kit form add to GA's competition although much less so partly as Experimentals have been around much longer.
Overall, the overall GA fleet has held reasonably steady despite the references above, declining from a peak of piston airplanes in FAA's registry of 197,442 in 1984 to 137,655 in 2013, a drop of about 30%. When you add kit-built aircraft and LSA, the total fleet numbers look relatively stable.
In geographic location of that U.S. aircraft fleet the conventional knowledge about the biggest three states still holds, with California having 26,141 aircraft registered, followed by Texas at 22,851, trailed by Florida at 18,162. The next closest state (Washington) has barely half the Florida count ... but see below for where pilots live.
 The number of airmen — pilots with certificates — explains some of the aircraft delivery decreases. From a peak in GAMA's numbers of 827,071 licensed pilots in 1980 to the current number of 593,499, I calculate a drop of 28% over 34 years. Keep in mind that nearly 47,000 of those airmen are not Americans but foreign nationals holding a U.S. certificate. Private Pilots have dropped by 51%, but many of those probably went on to higher ratings as ATPs grew by 120% in the same period to account for 26% of all certificate holders. No doubt related to that, CFIs grew by 67% to become 17% of all certificate holders and pilots with Instrument ratings also increased by 18%. Those holding a Spot Pilot certificate now totals 5,157, reported GAMA, while Recreational Pilot peaked at 343 in 1999 and has since shrunk to only 220 certificates. Neither of the last two amount to even 1% of all license holders though the other certificate categories have several decades of history the newer ones lack.
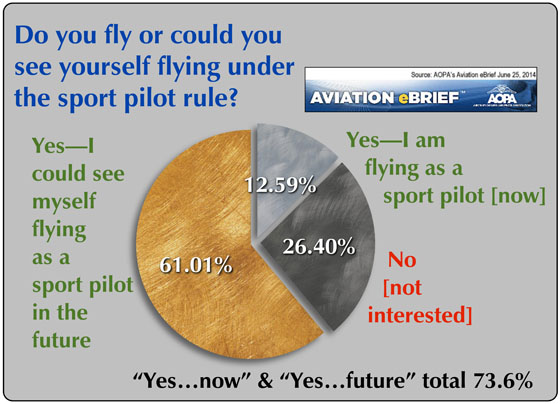
You might lament the Sport Pilot certificate numbers. Certainly, many in the GA world thought Sport Pilot was single-handedly going to grow the pilot population a lot more. While I do not believe that was ever a realistic expectation, here's some good news.
Most pilots I know think the pilot population is graying quickly and that we may be in danger of running out of pilots. GAMA's stats say otherwise. The biggest single category may be what you expect with those aged 50-64 counting 179,277 pilots but the surprising second largest segment is close behind. Those aged a young 20-35 years old number 173,396 pilots. The 35-50 cohort is much smaller, perhaps as they are busy raising families and paying for mortgages and college eductions for their kids.
In the top ten states for pilot populations, California still leads with 59,213 but Florida has climbed into the number #2 slot at 52,976 — and the state is number one in flight instructors with 9,592 — followed by Texas with 49,614 total pilots, Washington state (18,665), Georgia (18,131), Arizona (18,029), Illinois (16,307), New York (15,949), Pennsylvania (15,187), and Ohio (15,137).
Now let's look at LSA-type aircraft elsewhere in the world. I have
The number of airmen — pilots with certificates — explains some of the aircraft delivery decreases. From a peak in GAMA's numbers of 827,071 licensed pilots in 1980 to the current number of 593,499, I calculate a drop of 28% over 34 years. Keep in mind that nearly 47,000 of those airmen are not Americans but foreign nationals holding a U.S. certificate. Private Pilots have dropped by 51%, but many of those probably went on to higher ratings as ATPs grew by 120% in the same period to account for 26% of all certificate holders. No doubt related to that, CFIs grew by 67% to become 17% of all certificate holders and pilots with Instrument ratings also increased by 18%. Those holding a Spot Pilot certificate now totals 5,157, reported GAMA, while Recreational Pilot peaked at 343 in 1999 and has since shrunk to only 220 certificates. Neither of the last two amount to even 1% of all license holders though the other certificate categories have several decades of history the newer ones lack.
You might lament the Sport Pilot certificate numbers. Certainly, many in the GA world thought Sport Pilot was single-handedly going to grow the pilot population a lot more. While I do not believe that was ever a realistic expectation, here's some good news.
Most pilots I know think the pilot population is graying quickly and that we may be in danger of running out of pilots. GAMA's stats say otherwise. The biggest single category may be what you expect with those aged 50-64 counting 179,277 pilots but the surprising second largest segment is close behind. Those aged a young 20-35 years old number 173,396 pilots. The 35-50 cohort is much smaller, perhaps as they are busy raising families and paying for mortgages and college eductions for their kids.
In the top ten states for pilot populations, California still leads with 59,213 but Florida has climbed into the number #2 slot at 52,976 — and the state is number one in flight instructors with 9,592 — followed by Texas with 49,614 total pilots, Washington state (18,665), Georgia (18,131), Arizona (18,029), Illinois (16,307), New York (15,949), Pennsylvania (15,187), and Ohio (15,137).
Now let's look at LSA-type aircraft elsewhere in the world. I have  Where I could identify microlights, ultralights, or LSA types, I calculated 19,613 aircraft in what might be called "greater Europe" (mostly EU countries). Making an informed guess of at least 4,000 "microlight/ultralight" for Germany — which country, as noted above, did not supply a detailed value for this category — and adding non-European countries such as South Africa (6,072 including "Sport, Recreational, and Experimental"), Canada (7,125 "ultralights"), and Brazil plus Asian countries (small counts for several nations), I make a best estimate of about 40,000 LSA-type aircraft outside the USA. This figure includes estimates for Sweden and Switzerland that did not break out their reporting. Also included in the 40,000 count is England with strong numbers of 4,029 "microlights" and 3,269 "Fixed Wing Aeroplanes of less than 750 kilograms" (1,650 pounds). See updated figures in
Update Notice — The following article has been updated to reflect additional information. Please read at this link. Thanks to a solid effort by GAMA, the General Aviation Manufacturers Association, I have data that can be used to assess the numbers of recreational aircraft around the world. That organization is significantly focused on business aircraft but did include all levels of aircraft in their country-by-country review. Whatever the actual level of accuracy — GAMA is wholly dependent on the data the organization received from various CAAs in each country — GAMA’s data is some very useful info and I am in their debt for the information discussed in this review. In addition to GAMA having to use whatever each country reported, the methods of reporting were not consistent. For one noteworthy example, several countries listed as their smallest aircraft those weighing 5,700 kilograms (12,540 pounds), which represents far larger aircraft than your typical four-seat GA aircraft and certainly any recreational aircraft.

 As the new year dawned my good friends at General Aviation News published my article on the light aircraft industry using Rotax deliveries (and estimates of other engine brands) to estimate worldwide sales of recreational or sport aircraft. The article was presented online as 2015 began and has since appeared in a print edition. This article was updated 1/12/15 and 1/23/15.
On the "The Pulse of Aviation" (
As the new year dawned my good friends at General Aviation News published my article on the light aircraft industry using Rotax deliveries (and estimates of other engine brands) to estimate worldwide sales of recreational or sport aircraft. The article was presented online as 2015 began and has since appeared in a print edition. This article was updated 1/12/15 and 1/23/15.
On the "The Pulse of Aviation" (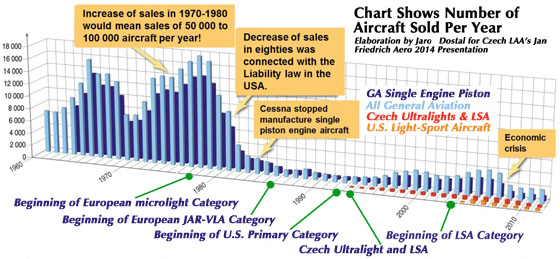 Here I present a somewhat different message. The first article was aimed at an audience including general aviation pilots, many of whom do not know the LSA or light kit community well. This one is aimed at those following light aviation more closely.
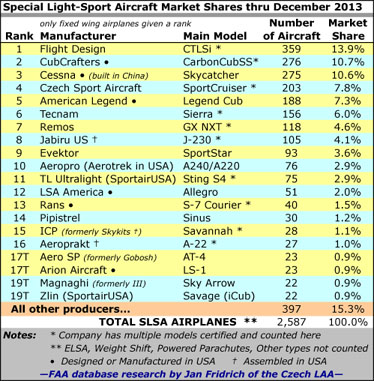
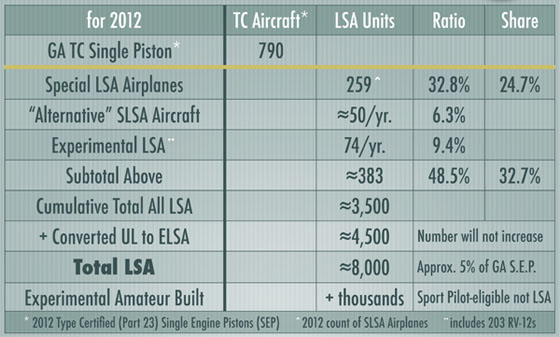
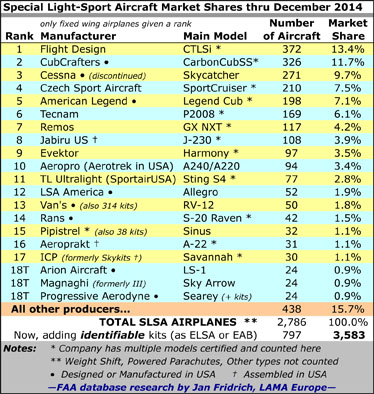
As detailed in the GA News article, I reported a market for very light aircraft and Light-Sport-type aircraft that substantially exceeds 3,000 units per year worldwide. Many American pilots remain unaware that the rest of the world flies a large number of light aircraft in the recreational or sporting categories. Overseas, these are commonly referred to as Ultralights or Microlights, Very Light Aircraft, or Light-Sport Aircraft. As you probably know Euro Ultralights are quite different from the U.S. version.
Most pilots in the USA focus on what are sometimes called "traditional" general aviation aircraft for which GAMA has reported delivery numbers for many years. Regular tallies of FAA's N-number registration database show that in the USA the ratio is approximately 80/20, traditional GA airplanes to recreational aircraft. In Europe and most other countries that ratio is reversed with GA representing approximately 20% of all civilian aircraft with 80% recreational, according to people who try to assess such figures. This large percentage includes gliders (very big in Europe) but even omitting sailplanes the ratio is quite lopsided in favor of powered recreational aircraft. For most international pilots, GA aircraft are too expensive to buy and operate outside the USA.
Here I present a somewhat different message. The first article was aimed at an audience including general aviation pilots, many of whom do not know the LSA or light kit community well. This one is aimed at those following light aviation more closely.
As detailed in the GA News article, I reported a market for very light aircraft and Light-Sport-type aircraft that substantially exceeds 3,000 units per year worldwide. Many American pilots remain unaware that the rest of the world flies a large number of light aircraft in the recreational or sporting categories. Overseas, these are commonly referred to as Ultralights or Microlights, Very Light Aircraft, or Light-Sport Aircraft. As you probably know Euro Ultralights are quite different from the U.S. version.
Most pilots in the USA focus on what are sometimes called "traditional" general aviation aircraft for which GAMA has reported delivery numbers for many years. Regular tallies of FAA's N-number registration database show that in the USA the ratio is approximately 80/20, traditional GA airplanes to recreational aircraft. In Europe and most other countries that ratio is reversed with GA representing approximately 20% of all civilian aircraft with 80% recreational, according to people who try to assess such figures. This large percentage includes gliders (very big in Europe) but even omitting sailplanes the ratio is quite lopsided in favor of powered recreational aircraft. For most international pilots, GA aircraft are too expensive to buy and operate outside the USA.
 "From 1989 through June 5th, 2014, we have sold 50,000 four-stroke engines of the 912 and 914 model designation," noted Christian Mundigler, Key Account Manager of
 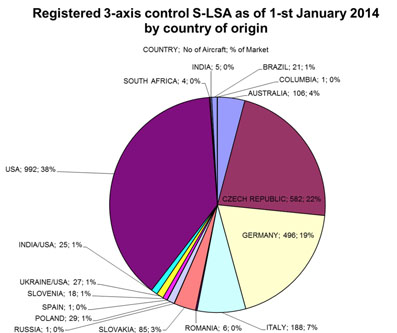 In comparison, GAMA will likely report less than 1,100 piston-powered aircraft of all types and sizes from all association members around the globe for 2014 based on information released for the first nine months of the year.
Thus, when you include shipments to all countries, the light recreational aircraft market represents a large portion of all civilian, non-commercial airplanes being delivered.
With the American LSA and light kit market taking less than 1,000 of the Rotax's annual 3,000-plus aircraft engine production, where are all the others going?
"Averaging over a long term our main engine market, including two- and four-stroke powerplants, Europe has around half of the share," reported Mundigler. "The Americas, including North, Central, and South, has about a third of the total."
"Growing markets are Russia and China with double digit increase rates in recent years," said Mundigler.
Rotax engines run fine on auto gasoline or 100LL aviation fuel; operators can mix mogas and avgas in any proportion without concern. Jabiru also works fine with mogas and Continental has engine models that do as well. Around the world, aviation fuel is not widely available and, as American pilots know, avgas carries a substantial price premium though much less than the $10-12 per gallon in Europe.
From the figures used in this article, we can see the light, recreational aircraft industry is alive and well and makes up the largest unit volume share of all aircraft delivered each year.
In comparison, GAMA will likely report less than 1,100 piston-powered aircraft of all types and sizes from all association members around the globe for 2014 based on information released for the first nine months of the year.
Thus, when you include shipments to all countries, the light recreational aircraft market represents a large portion of all civilian, non-commercial airplanes being delivered.
With the American LSA and light kit market taking less than 1,000 of the Rotax's annual 3,000-plus aircraft engine production, where are all the others going?
"Averaging over a long term our main engine market, including two- and four-stroke powerplants, Europe has around half of the share," reported Mundigler. "The Americas, including North, Central, and South, has about a third of the total."
"Growing markets are Russia and China with double digit increase rates in recent years," said Mundigler.
Rotax engines run fine on auto gasoline or 100LL aviation fuel; operators can mix mogas and avgas in any proportion without concern. Jabiru also works fine with mogas and Continental has engine models that do as well. Around the world, aviation fuel is not widely available and, as American pilots know, avgas carries a substantial price premium though much less than the $10-12 per gallon in Europe.
From the figures used in this article, we can see the light, recreational aircraft industry is alive and well and makes up the largest unit volume share of all aircraft delivered each year.
 Much of what we hear and know about airplane populations is centered on America. Yet in the world of sport and recreational aviation, the rest of the world equates to at least a 1:1 relationship, that is, for every American aircraft flying, many experts agree another flies internationally. It may be more significant than that ... consider Germany.
In mid-August, our friends at Aerokurier, Germany's leading aviation magazine, assembled an
Much of what we hear and know about airplane populations is centered on America. Yet in the world of sport and recreational aviation, the rest of the world equates to at least a 1:1 relationship, that is, for every American aircraft flying, many experts agree another flies internationally. It may be more significant than that ... consider Germany.
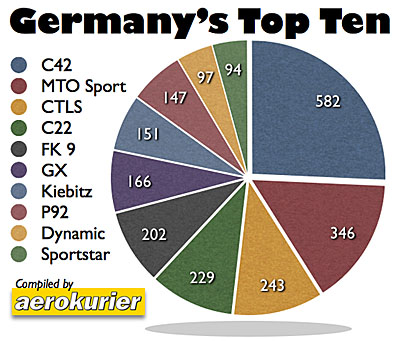
In mid-August, our friends at Aerokurier, Germany's leading aviation magazine, assembled an 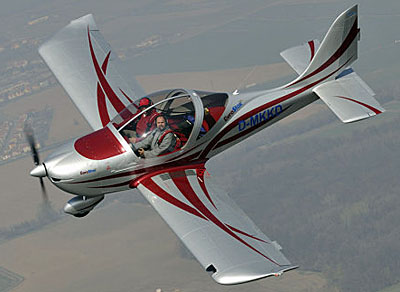 #10 — Evektor Eurostar (94 flying) — Built by
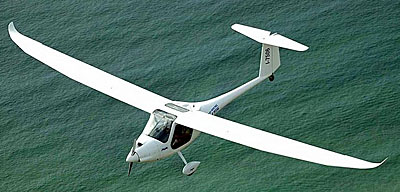
 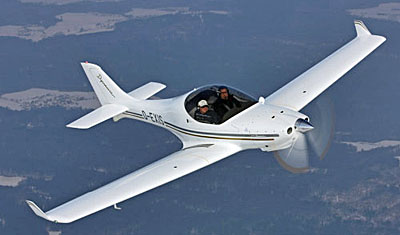 #9 — AeroSpool Dynamic (97 flying) — It's fast and belongs to the ultralight beauties at the sky. Built in Slovakia WT9 Dynamic is the epitome of a sporty composite low-wing monoplane. Capable of more than 200 km/h (125 mph) it excels at cross country flying, is comfortable, and can even tow gliders. Dynamic's flight characteristics are exemplary processing. |||| Dynamic in fixed gear form has some U.S. models flying but after Sport Aircraft Works left the business sales slowed to a stop and it never entered the Top-20 of the American LSA market.
 #8 — P92 (147 flying) —
 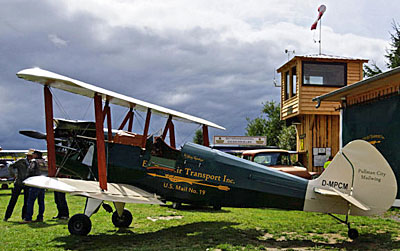 #7 — Kiebitz (151 flying) — The biplane from designer Michael Platzer has a huge following in Germany. Hardly any other ultralight gives so much fun flying in an open cockpit. To win this jewel, owners must either build it or seek one from the used market. Only plans and individual parts are offered, however, for many the effort is worthwhile. |||| Kiebitz has no U.S. market presence yet given the interest in vintage designs like the many Cubalikes, perhaps some interest can develop. On the other hand, Americans already have many choices in the world of homebuilt vintage aircraft so we may never see a Kiebitz in the USA.
 #6 — Remos GX (166 flying) — Remos Aircraft started in the mid-1990s with the introduction of its composite high wing G-3 that became popular with many ultralight pilots. Professionally produced and easy to fly this ultralight earned an excellent reputation in the industry. Several years ago, the company offered an updated GX version, which was proceeding toward European LSA approval [a more complicated and costly process than in the USA]. After a difficult time in recent years, production restarted in 2013. |||| Even after stalling badly following a tremendous promotional push, Remos still owns the #7 spot in the American LSA ranking, although reports of added financial challenge continue to dog the company. The airplane was marketed more heavily than any other LSA brand and won many happy customers.
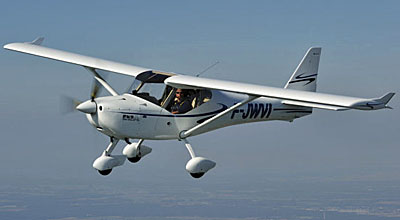 #5 — FK 9 (202 flying) — With the FK 9 Peter and his father Otto Funk [who died in 2014] presented their first FK 9 at Aero 1989 as one of the first "cabin class" ultralights replacing earlier aircraft that were far more basic. Today, the high wing is a model of success that is enjoys great popularity with many clubs and flight schools in Germany. New model innovations ensure continued success in the market. Older models are on the second hand market remain extremely popular. Today, the aircraft is built by FK-Lightplanes in Poland. |||| FK 9 enjoys market presence and current representation by
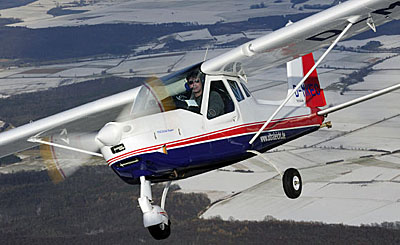
 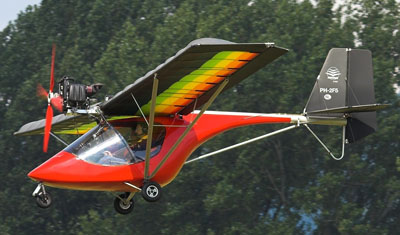 #4 — C22 (229 flying) — Germany's ultralight classic C22 has a loyal following to this day. Since the 1980s the model has stayed on the market and many still authorized aircraft remain active. From today's perspective, flight characteristics and comfort may seem rather spartan, but real ultralight fans love the original flying with the proven tube & Dacron construction from Comco Ikarus based in the south of Germany. [Note that Comco Ikarus also owns the #1 position in the market making this company Germany's clear leader after many years.] |||| No C22s are flying in the USA, nor has the German market leading C42 found many customers. The C22 is very similar to the
 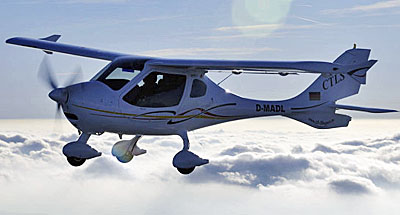 #3 — CTLS (243 flying) — From generation to generation the CT series from
 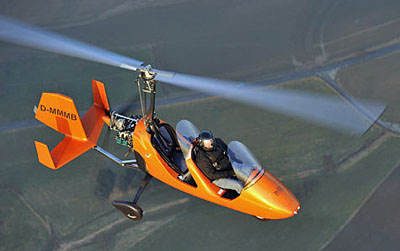 #2 — MTO Sport (346 flying) — This gyroplane is a case of the right product at the right time. In 2004, when the first MT-03 was first built, CEO Otmar Birkner had no idea he would trigger a surprising boom with gyroplanes. Many pilots love to be in the open cockpit feel the wind in your hair and to experience the flying dynamics of an autogyro. Today AutoGyro from the north of Germany is the world's leader in the gyro business. The MT-03 and its successor MTO Sport end up together in second place in Germany's registration statistics. |||| AutoGyro and other gyro providers operate in America but as FAA cannot seem to overcome their own rules, these popular planes must be built as Experimental Amateur Built (the 51% rule). If FAA ever catches up with the trend, look for more gyros to be flying as Americans seems to like the fully enclosed two seaters in tandem and side by side form.
  #1 — C42 (582 flying) — Germany's most popular ultralight comes from the south of Germany. C42 by Comco Ikarus secures first place with 582 licensed copies of this tube & Dacron, high wing monoplane. It has been refined repeatedly over the years and currently the manufacturer produces three versions: C42A, C42B and C42C. The aircraft is very easy to use and is widely used by flying clubs and their flight schools. |||| The clear king of ultralights in Germany has 70% more aircraft registered than the number two producer and represents more than 25% of Germany's Top-10, a stronger position than even the top two U.S. LSA producers put together. While Comco Ikarus has attempted to gain an American foothold, exhibiting at big events such as AirVenture in past years, the company has never found either the right representation nor market reception, though admittedly the U.S. market is crowded with great competition for customer attention.
As you can see, the Germany and American markets have their differences but also enjoy great similarity. Germany is one of the very strongest light aircraft markets outside the U.S., trailed in approximate order by the Czech Republic, France, Britain, Spain, Italy and others. The American market remains the world's largest for light aircraft of all types, but in the world of sport and recreation is closely trailed by other countries.
#1 — C42 (582 flying) — Germany's most popular ultralight comes from the south of Germany. C42 by Comco Ikarus secures first place with 582 licensed copies of this tube & Dacron, high wing monoplane. It has been refined repeatedly over the years and currently the manufacturer produces three versions: C42A, C42B and C42C. The aircraft is very easy to use and is widely used by flying clubs and their flight schools. |||| The clear king of ultralights in Germany has 70% more aircraft registered than the number two producer and represents more than 25% of Germany's Top-10, a stronger position than even the top two U.S. LSA producers put together. While Comco Ikarus has attempted to gain an American foothold, exhibiting at big events such as AirVenture in past years, the company has never found either the right representation nor market reception, though admittedly the U.S. market is crowded with great competition for customer attention.
As you can see, the Germany and American markets have their differences but also enjoy great similarity. Germany is one of the very strongest light aircraft markets outside the U.S., trailed in approximate order by the Czech Republic, France, Britain, Spain, Italy and others. The American market remains the world's largest for light aircraft of all types, but in the world of sport and recreation is closely trailed by other countries.